Developing SQL Databases 온라인 연습
최종 업데이트 시간: 2025년03월22일
당신은 온라인 연습 문제를 통해 Microsoft 70-762 시험지식에 대해 자신이 어떻게 알고 있는지 파악한 후 시험 참가 신청 여부를 결정할 수 있다.
시험을 100% 합격하고 시험 준비 시간을 35% 절약하기를 바라며 70-762 덤프 (최신 실제 시험 문제)를 사용 선택하여 현재 최신 160개의 시험 문제와 답을 포함하십시오.
정답: B
Explanation:
sys.dm_exec_sessions returns one row per authenticated session on SQL Server. sys.dm_exec_sessions is a server-scope view that shows information about all active user connections and internal tasks. This information includes client version, client program name, client login time, login user, current session setting, and more. Use sys.dm_exec_sessions to first view the current system load and to identify a session of interest, and then learn more information about that session by using other dynamic management views or dynamic management functions.
Examples of use include finding long-running cursors, and finding idle sessions that have open transactions.
정답: F
Explanation:
To view deadlock information, the Database Engine provides monitoring tools in the form of two trace flags, and the deadlock graph event in SQL Server Profiler.
Trace Flag 1204 and Trace Flag 1222
When deadlocks occur, trace flag 1204 and trace flag 1222 return information that is captured in the SQL Server error log. Trace flag 1204 reports deadlock information formatted by each nodeinvolved in the deadlock. Trace flag 1222 formats deadlock information, first by processes and then by resources. It is possible to enable bothtrace flags to obtain two representations of the same deadlock event.
References: https://technet.microsoft.com/en-us/library/ms178104(v=sql.105).aspx
정답:
Explanation:
sys.dm_os_wait_stats returns information about all the waits encountered by threads that executed. You can use this aggregated view to diagnose performance issues with SQL Server and also with specific queries and batches.

정답: 
Explanation:
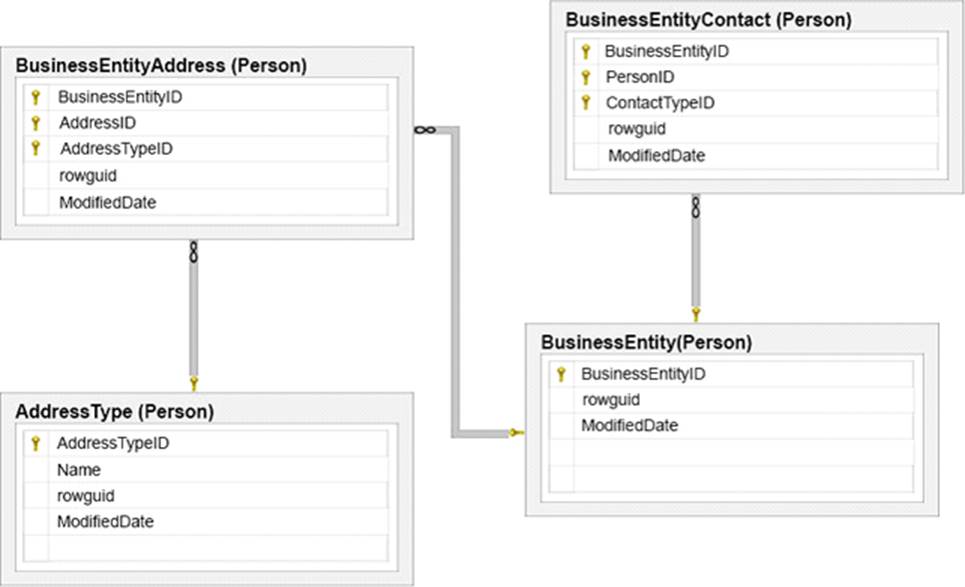
The entities on the many side, of the 1-many relations, must be added before we add the entities on the 1side.
We must insert new rows into BusinessEntityContact and BusinessEntityAddress tables, before we insert the corresponding rows into the BusinessEntity and AddressType tables.
정답:
Explanation:
When you use the SchemaBinding keyword while creating a view or function you bind the structure of any underlying tables or views. Itmeans that as long as that schemabound object exists as a schemabound object (ie you don’t remove schemabinding) you are limited in changes that can be made to the tables or views that it refers to.
References: https://sqlstudies.com/2014/08/06/schemabinding-what-why/
정답:
Explanation:
The common language runtime (CLR) is the heart of the Microsoft .NET Framework andprovides the execution environment for all .NET Framework code. Code that runs within the CLR is referred to as managed code.
With the CLR hosted in Microsoft SQL Server (called CLR integration), you can author stored procedures,
triggers, user-defined functions, user-defined types, and user-defined aggregates in managed code. Because managed code compiles to native code prior to execution, you can achieve significant performance increases in some scenarios.
정답:
Explanation:
User-defined scalar functions return a single data value of the type defined in the RETURNS clause.
References: https://technet.microsoft.com/en-us/library/ms177499(v=sql.105).aspx
정답:
Explanation:
You can create a database object inside SQL Server that is programmed in an assembly created in the Microsoft .NET Framework common language runtime (CLR). Database objects that can leverage the rich programmingmodel provided by the CLR include DML triggers, DDL triggers, stored procedures, functions, aggregate functions, and types.
Creating a CLR trigger (DML or DDL) in SQL Server involves the following steps:
Define the trigger as a class in a .NETFramework-supported language. For more information about how to program triggers in the CLR, see CLR Triggers. Then, compile the class to build an assembly in the .NET Framework using the appropriate language compiler.
Register the assembly in SQL Server using the CREATE ASSEMBLY statement. For more information about assemblies in SQL Server, see Assemblies (Database Engine).
Create the trigger that references the registered assembly.
References: https://msdn.microsoft.com/en-us/library/ms179562.aspx
정답:
Explanation:
DML triggers is a special type of stored procedure that automatically takes effect when a data manipulation language (DML) event takes place that affects the table or view defined in the trigger. DML events include INSERT, UPDATE, or DELETE statements. DML triggers can be usedto enforce business rules and data integrity, query other tables, and include complex Transact-SQL statements.
References: https://msdn.microsoft.com/en-us/library/ms178110.aspx
정답:
Explanation:
DML triggers is a special type of stored procedure that automatically takes effect when a data manipulation language (DML) event takes place that affects the table or view defined in the trigger. DML events include INSERT, UPDATE, or DELETE statements.DML triggers can be used to enforce business rules and data integrity, query other tables, and include complex Transact-SQL statements.
A CLR trigger is a type of DDL trigger. A CLR Trigger can be either an AFTER or INSTEAD OF trigger. A CLR trigger canalso be a DDL trigger. Instead of executing a Transact-SQL stored procedure, a CLR trigger executes one or more methods written in managed code that are members of an assembly created in the .NET Framework and uploaded in SQL Server.
References: https://msdn.microsoft.com/en-us/library/ms178110.aspx

정답: 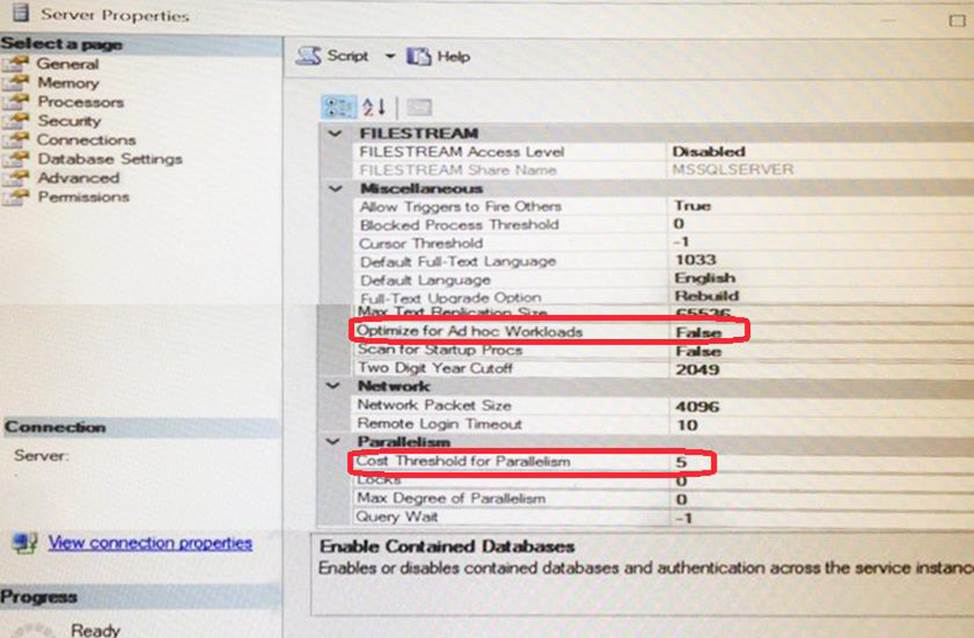
Explanation:
* Optimize for ad hoc workloads
The optimize for ad hoc workloads option is used to improve the efficiency of the plan cache for workloads that contain many single use ad hoc batches. When this option is set to 1, the Database Engine stores a small compiled plan stub in the plan cache when a batch is compiled for the first time, instead of the full compiled plan. This helps to relieve memory pressure by not allowing the plan cache to become filled with compiled plans that are not reused.
* Cost Threshold for Parallelism
Use the cost threshold for parallelism option to specify the threshold at which Microsoft SQL Server creates and runs parallel plans for queries. SQL Server creates and runs a parallel plan for a query only when the estimated cost to run a serial plan for the same query is higher than the value set in cost threshold for parallelism. The cost refers to an estimated elapsed time in seconds required to run the serial plan on a specific hardware configuration.
5 means 5 seconds, but is is 5 seconds on a machine internal to Microsoft from some time in the 1990s. There's no way to relate it to execution time on your current machine, so we treat it as a pure number now. Raising it to 50 is a common suggestion nowadays, so that more of your simpler queries run on a single thread.
정답: 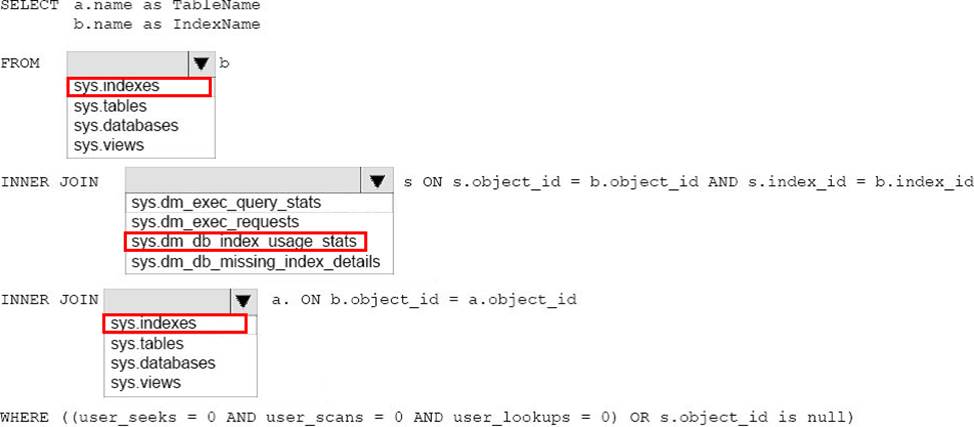
Explanation:
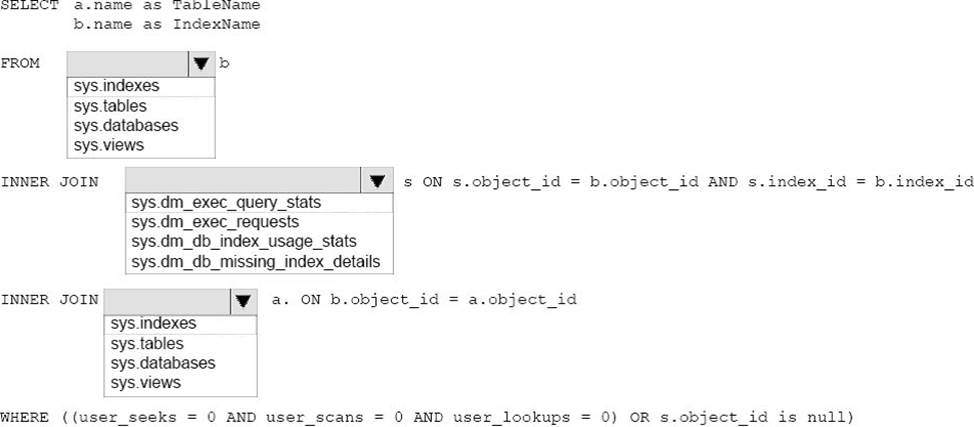
Example: Following query helps you to find all unused indexes within database using sys.dm_db_index_usage_stats DMV.
-- Ensure a USE statement has been executed first.
SELECT u.*
FROM [sys].[indexes] i
INNER JOIN [sys].[objects] o ON (i.OBJECT_ID = o.OBJECT_ID)
LEFT JOIN [sys].[dm_db_index_usage_stats] u ON (i.OBJECT_ID = u.OBJECT_ID)
AND i.[index_id] = u.[index_id]
AND u.[database_id] = DB_ID() --returning the database ID of the current database
WHERE o.[type] <> 'S' --shouldn't be a system base table
AND i.[type_desc] <> 'HEAP'
AND i.[name] NOT LIKE 'PK_%'
AND u.[user_seeks] + u.[user_scans] + u.[user_lookups] = 0
AND u.[last_system_scan] IS NOT NULL
ORDER BY 1 ASC
References: https://basitaalishan.com/2012/06/15/find-unused-indexes-using-sys-dm_db_index_usage_stats/
정답: 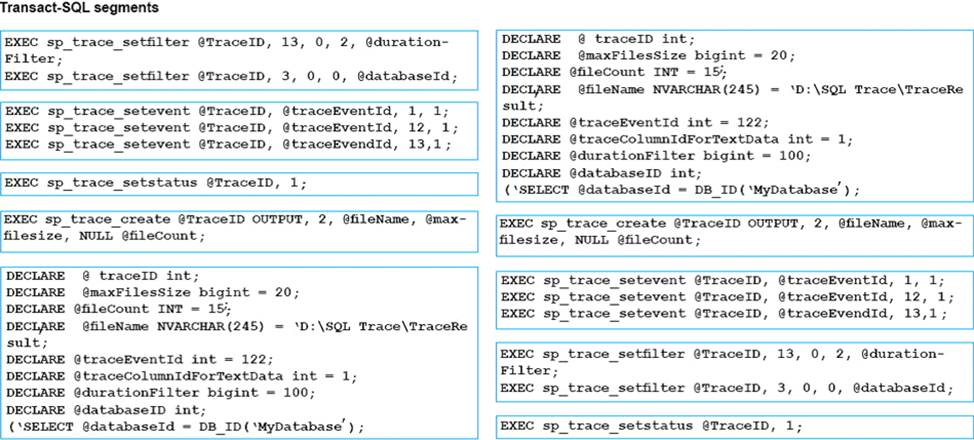
Explanation:
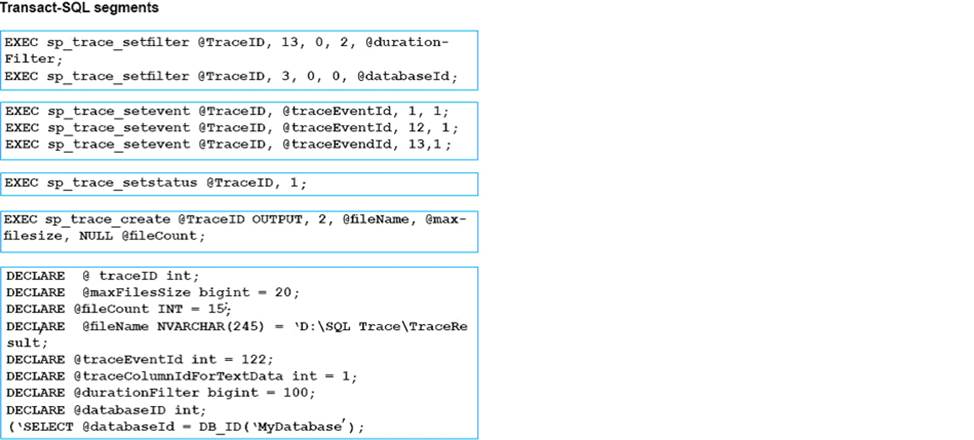
The following system stored procedures are used to define and manage traces:
* sp_trace_create is used to define a trace and specify an output file location as well asother options that I’ll cover in the coming pages. This stored procedure returns a handle to the created trace, in the form of an integer trace ID.
* sp_trace_setevent is used to add event/column combinations to traces based on the trace ID, as well as toremove them, if necessary, from traces in which they have already been defined.
* sp_trace_setfilter is used to define event filters based on trace columns.
* sp_trace_setstatus is called to turn on a trace, to stop a trace, and to delete a trace definitiononce you’re done with it. Traces can be started and stopped multiple times over their lifespan.
References: https://msdn.microsoft.com/en-us/library/cc293613.aspx
정답: 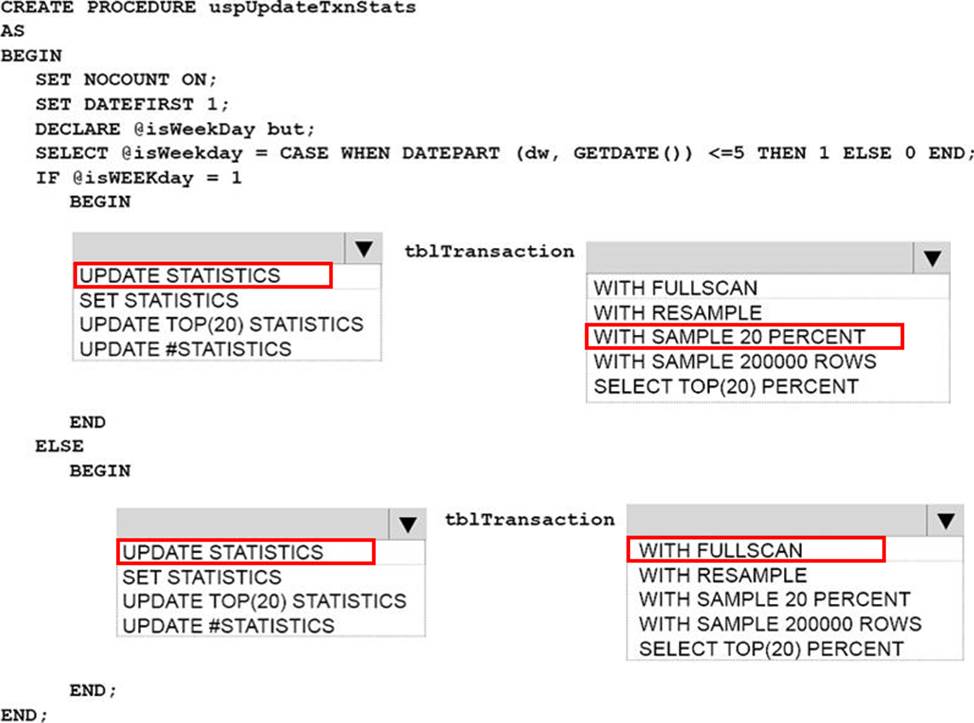
Explanation:
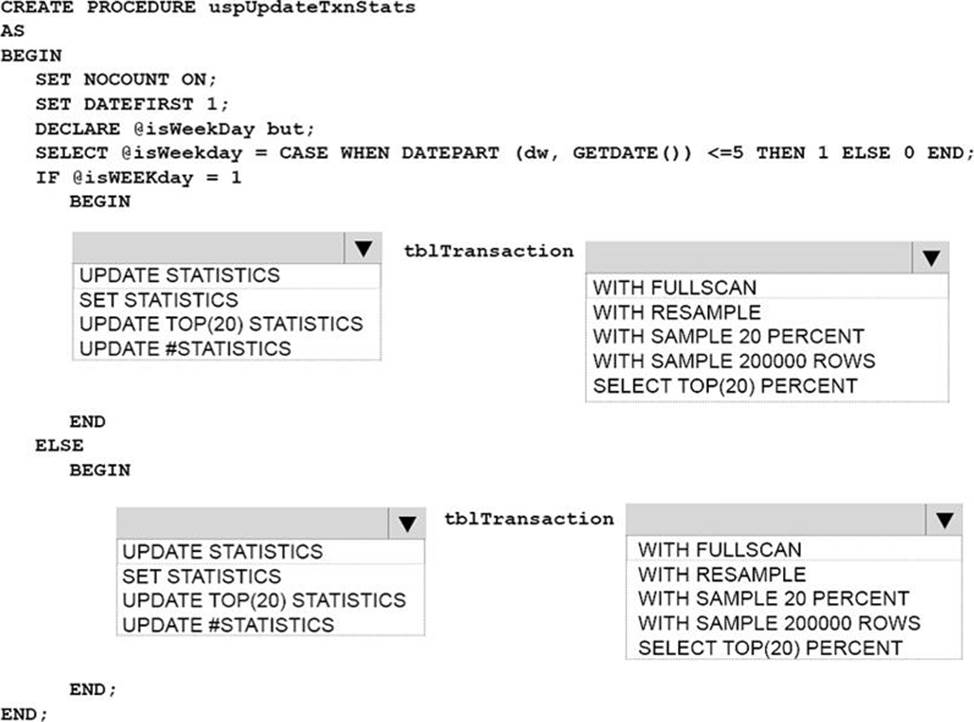
Box 1: UPDATE STATISTICS
Box 2: SAMPLE 20 PERCENT
UPDATE STATISTICS tablenameSAMPLE number { PERCENT | ROWS }
Specifies the approximate percentage or number of rows in the table or indexed view for the query optimizer to use when it updates statistics. For PERCENT, number can be from 0 through 100 and for ROWS, number can be from0 to the total number of rows.
Box 3: UPDATE STATISTICS
Box 4: WITH FULLSCAN
FULLSCAN computes statistics by scanning all rows in the table or indexed view. FULLSCAN and SAMPLE 100 PERCENT have the same results. FULLSCAN cannot be used with the SAMPLE option.
References: https://msdn.microsoft.com/en-us/library/ms187348.aspx
정답:
Explanation:
sys.dm_exec_session_wait_stats returns information about all the waits encountered by threads that executed for each session. You can use this view to diagnose performance issues with the SQL Server session and also with specific queries and batches.
Note: SQL Server wait stats are, at their highest conceptual level, grouped into two broad categories: signal waits and resource waits. A signal wait is accumulated by processes running on SQL Server which are waiting for a CPU to become available (so called because the process has “signaled” that it is ready for processing). A resource wait is accumulated by processes running on SQL Server which are waiting fora specific resource to become available, such as waiting for the release of a lock on a specific record.